
How to Use Chart Patterns to Bolster Your Retirement

Editor’s Note: As promised, today Chief Income Strategist Marc Lichtenfeld is introducing you to his favorite chart pattern, the “World Record Pattern.” (Click here to get the full story!)
Many of you likely know that Marc is a big believer in the power of chart patterns. But what you may not realize is that they aren’t just for day traders. As Marc explains with examples below, even the most conservative, long-term investors (including those who are in or nearing retirement) could benefit from learning how to read a stock chart.
And there’s only one pattern that owns the prestigious title of the best-performing chart pattern of all time…
Go here to let Marc tell you all about it.
– Rachel Gearhart, Publisher
Early in my career, I was smart enough to know what I didn’t know (which was practically everything). So I tried to absorb all that I could from books, classes, websites and people.
To find a way to make sense of the market action I observed every day, I set out to learn technical analysis, the study of stock charts.
Then I caught a lucky break.
I was sitting in my cubicle one day when I got an email from a headhunter about an analyst position. The recruiter told me the job was with Avalon Research Group, which was the most contrarian firm on Wall Street.
“You have to get me in the door for an interview,” I told her. I knew that learning fundamental research from the company’s research director would take my skills to another level.
She did end up getting me an interview, and I got the job.
After several months of soaking up all the knowledge I could, my research director asked me to create a chart product for our customers, which allowed me to combine my technical and fundamental research skills.
Often, technical analysts believe you can tell everything you need to know about a stock by looking at its chart. Fundamental analysts, on the other hand, typically believe charts are voodoo and that everything you need to know about a stock can be found in its financial statements, sector news, valuation, etc.
I see the value of both practices, and depending on what kind of action I’m taking, I weigh one more heavily than the other.
The Long and Short of It
If I’m making a short-term trade, all I care about is the flow of money into and out of the stock, which is what a stock chart shows. The stock’s price-to-earnings ratio, profit margins and balance sheet are meaningless (unless there’s a catalyst coming up like earnings, in which case traders need to be aware that the catalyst could affect the stock).
If there is more buying activity than selling, the chart will reflect that, as the stock’s price will rise. If there’s more selling activity, it will lead to a lower price for the stock and a downward-pointing chart.
Most importantly, I use support and resistance levels – areas where a stock stops going down or up, respectively – to determine my entry and exit points. We don’t know why it stops moving at these price levels, and we don’t really care. We just know that buying or selling increases at these levels, and we use that to our advantage.
Here’s an example in the chart of Playa Hotels & Resorts (Nasdaq: PLYA).
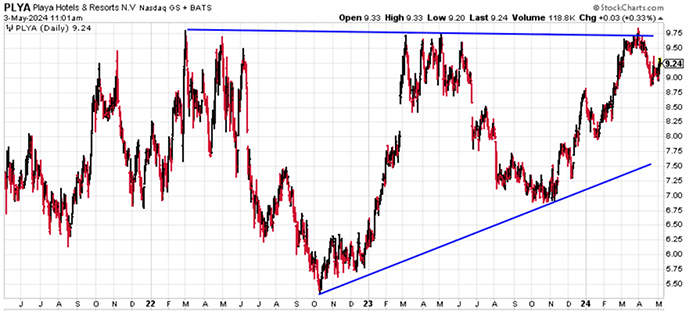
You can see that the stock’s lows are rising and that we can draw a line of support connecting them. This is called an uptrend line.
Based on this trend line, if the stock drops, we would expect it to stop dropping at around $7.50. That would be a great spot to buy because we know the stock will likely have support at $7.50 – and if it goes below $7.50, we’ll know that the trend has been broken, so we could get out quickly with a small loss.
You likely also notice that each time the stock hit about $9.75, it failed to go higher. We can use that price point to our advantage as well.
If we were to buy the stock after a drop to $7.50, we would already know what price we’d expect it to rise to. So we’d have a predetermined price target, and we would know that we’re taking on just a little bit of risk in order to capture a decent-sized profit.
Alternatively, instead of buying after a drop to $7.50, we could wait until the stock breaks through the $9.75 resistance level. In that case, we certainly wouldn’t be buying at the lows, but we’d have a lot more confidence that the stock would continue higher, because it would’ve finally broken through after many failed attempts.
Now, you might think technical analysis is only useful for short-term trades. But it can also be an invaluable timing tool for your longer-term investing.
If you’re looking for stocks to own for a while, I strongly recommend you use fundamentals to understand companies’ businesses, financial strength, ability to grow their earnings and cash flow, etc., before you buy.
Then, once you find a stock whose fundamentals you like, you can use technicals to get in at a good price and make sure you’re not sitting on dead money.
If you’d liked Playa Hotels as a long-term investment a year ago, buying it at $9.75 would not have been a wise choice. You would’ve watched it fall, then climb, then fall again… and you would’ve made no money.
But if you’d identified the stock ahead of time and paid attention to its chart, you would’ve known that you had a good chance of getting it cheaper in the future as it drifted back down to its trend line. If you like the stock at $9.75, you’ll love it at $7.50!
Nearly all of the world’s best traders use technical analysis for their short-term trading. And the smart long-term investors do as well, because it helps them get the best prices possible and ensure their money is working for them.
What good is a great business if it takes the stock three years to make you money? Learn to use the charts to fine-tune your entries and exits, and you will be a much better investor – with a much better chance of securing a wealthy (or wealthier) retirement.
Good investing,
Marc
P.S. If you haven’t taken a few minutes to watch my video on the World Record Pattern yet, I highly recommend doing so as soon as you can. I’ve used this pattern time and time again to help my readers book exceptional triple-digit gains.
Go here to learn how to put the World Record Pattern to work for your portfolio.


Editor’s Note: Today’s guest column on the potential for a “business bonanza” in 2025 comes from Manward Press Chief…


Copyright © 2026 Retiring & Happy. All rights reserved.