PlannerPlus Retirement Calculator Review
If you’ve been reading Can I Retire Yet? as long as I have, you know there’s been no shortage of coverage on retirement calculators.
While doing research for this post, I dug up 22 such articles published on the site since 2012. Among them, no fewer than 82 distinct retirement calculators are mentioned. Of these, 20 were vetted and reviewed thoroughly by Chris and Darrow (one of them was birthed by none other than Darrow himself!).
In today’s post, I’ll review NewRetirement’s PlannerPlus retirement calculator. I’ll compare its features to those of Fidelity’s Investments’ Retirement Analysis tool (don’t worry if you don’t have an account at Fidelity–I use it here only as a basis for comparison).
To stay true to the rigor Chris and Darrow have brought to this topic in the past, I’ll take a deep dive into both tools, striving to match parameters and assumptions in such a way as to yield an apples-to-apples comparison.
Backstory
I first learned about NewRetirement in a review Chris published right here back in November 2020. Intrigued by his favorable coverage, and learning that NewRetirement offered a free tier–what they call simply the Basic edition–I decided to give it a try.
Fidelity’s online Retirement Analysis tool had been my go-to retirement calculator up to that point. I was quite pleased with its features, and had no intention of trading it in for another. All the same, the prospect of trying out a new calculator, and comparing its results to Fidelity, seemed like a good way to cross-check my assumptions.
I was sufficiently impressed with NewRetirement’s Basic edition to pull the trigger on PlannerPlus, a paid upgrade requiring a subscription. The cost was $72/year, billed annually, and it came with a no-nonsense cancellation policy (frugal consumer that I am, purchasing yet another subscription was no small feat).
I used PlannerPlus pretty extensively that first year. But as the renewal date approached, I decided to cancel my subscription. Why pay for a service I was getting elsewhere for free?
True to their word, NewRetirement canceled my subscription with nary a fuss, kindly requesting only that I tell them why. Here is what I wrote:
Thanks for your fast response, and above all for the hassle-free cancellation…the bottom line is that my retirement accounts are with Fidelity, who offer a very good retirement calculator free of charge. It does not make sense for me to pay for duplication…
NewRetirement Redux
Three years on, I have just taken the latest iteration of PlannerPlus for a test drive. To say it has come a long way since my first experience would be an understatement.
I am super impressed with its features and capabilities, and can now say unequivocally that it is superior to Fidelity’s Retirement Analysis tool. I explain why in the paragraphs that follow.
Basic Edition
Initial Setup
NewRetirement is centered around a wizard-style user interface that makes entering your information a breeze. It should take you no more than 5 or 10 minutes to complete the initial setup.
The hard part will be gathering your personal information; stuff you might not know off the top of your head, like account balances, expenses and expected social security benefits.
You’ll start with your account balances. The tool features an option to connect to your external accounts, thereby keeping the amounts in the tool synchronized with those accounts (I prefer to enter this information manually).
You’ll also need to enter an estimate of your monthly expenses. If you haven’t a clue what you spend, you can start with a rough guess. Then come back later to update it when you have a more accurate number.
You’ll also be asked to supply the social security benefit you expect to receive at your full retirement age (if you don’t know this number, it’s probably high time you find out). If you’re collecting social security already, this part should be easy.
For the purposes of this review, I set up a hypothetical portfolio consisting of liquid assets totaling $1.5M, spread over a variety of taxable and tax-advantaged accounts. I also include a $500K home equity component to round out the net worth at $2M. Finally, I plugged in my own expenses and social security estimates.
Plan Wellness
By the time you complete your first tour of the wizard, you’ll have a pretty good picture of your financial outlook.

The Plan Wellness chart forms the centerpiece of your individualized plan. Based on your inputs, it forecasts your savings each year over the course of your expected lifetime. It also forecasts your overall chance of success, where success is defined as not outliving your savings.
NewRetirement uses Monte Carlo analysis, randomly varying asset returns and inflation over many hundreds of hypothetical trials, to project likely outcomes in the Plan Wellness chart.
The top, light green line is a simple, linear projection of your lifetime savings based on your market return and inflation assumptions: optimistic, pessimistic or average.
The lower, dark green line represents the 90th percentile of Monte Carlo trials based on your return and inflation assumptions. This means that 90% of the trials projected outcomes that came in at or above this line. Conversely, 10% of the trials projected outcomes below this line.
Note that figures here and throughout the tool are expressed in future, or inflation-adjusted, dollars.
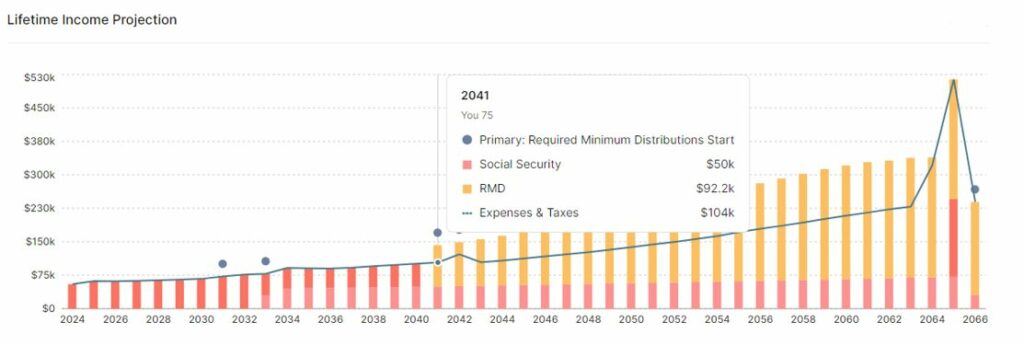
NewRetirement features dozens of insightful charts. Many of them, like the Lifetime Income Projection chart above, stay visible at all times on the right-hand side of your screen, and update in real-time to reflect any change you make to your plan.
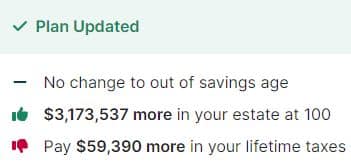
One of my favorite features is the Plan Updated popup, which appears any time I change an input or assumption. This gives me instant feedback on the impact of that change to my plan.
The popup above reflects a change in strategy for excess income over the course of my lifetime. Here it shows me the impact of redirecting that income from a non-interest-bearing checking account to a brokerage account, in which the money would be invested in the markets.
Opinionated Defaults
NewRetirement Basic comes out of the box with default, opinionated assumptions. These are for unknowns such as the magnitude and variability of market returns, inflation, social security cost of living adjustments, tax rates, etc.
That the assumptions are opinionated is not a bad thing. On the contrary, NewRetirment’s assumptions are well-informed. But without default assumptions, NewRetirement would not be able to deliver the easy-to-use, streamlined user experience that it does.
Market Returns
NewRetirement’s assumptions are conservative. For example, it forecasts market returns ranging from 2% to 5% for its pessimistic and optimistic extremes, respectively. It includes a middle return that is an arithmetic average of the two.
You supply the tool with a set of known quantities–your age, income, account balances, expenses and the like–and it spits out a plausible forecast of your financial future informed by these assumptions.
NewRetirement Basic is, by design, easy to use. It does not overwhelm you with a baffling array of knobs and dials, each of whose functions you must decipher and fine-tune manually.
PlannerPlus
If you’re like me, however, you like to turn knobs and dials. You want to try out your own assumptions; to ask what-if questions to see how well your nest egg might withstand different scenarios.
NewRetirement satisfies the needs of the timid and adventurous alike. If you are in the former camp, the Basic edition should more than fit the bill. But if you are in the latter, PlannerPlus gives you full control over the knobs and dials.
Portfolio Return Assumptions
Armed with the advanced feature set of PlannerPlus, the first thing I changed was the return assumptions on my hypothetical accounts. The default extremes–2% and 5%–are too conservative, in my opinion, particularly for my growth-oriented portfolio allocations.
To arrive at more realistic extremes, I ran a Monte Carlo analysis on each of my accounts using a magnificent (and free!) online tool called PortfolioVisualizer.
Here is a table that summarizes the results of that analysis.
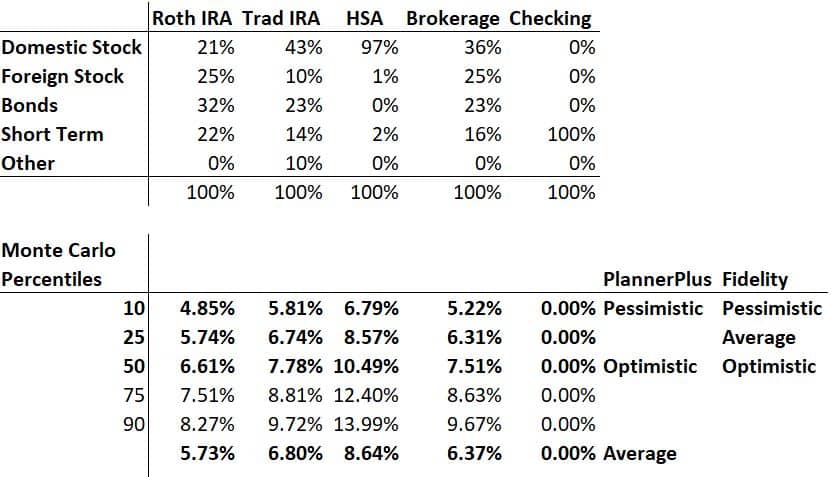
The Monte Carlo percentiles represent returns over a 40-year time period, which maps pretty closely to how much longer I expect to live (God willing).
I used the 10th percentile of outcomes for my pessimistic portfolio return assumptions, and the 50th percentile for my optimistic return assumptions. PlannerPlus takes the middle of these extremes to produce a third, average forecast.
Digging Deeper
To understand the values in the table above, let’s zero in on just the Roth IRA. Plugging in the allocation percentages for each asset class, PortfolioVisualizer ran 10,000 hypothetical trials, randomly varying annual returns in each trial based on the historical mean and volatility of the asset class.
The 10th percentile (pessimistic) represents the 10% of the 10,000 trials for which the return was 4.85% or lower. The 50th percentile (optimistic) represents the 50% of trials for which the return was 6.61% or lower.
I entered these values into the data entry screen for my Roth IRA in PlannerPlus.

Note the rate of return on my Roth IRA in the graphic below–it’s 5.73%. This is the arithmetic average of the optimistic and pessimistic assumptions I entered above.

This rate of return reflects my current selection for Inflation and Returns in the Assumptions control panel of PlannerPlus.
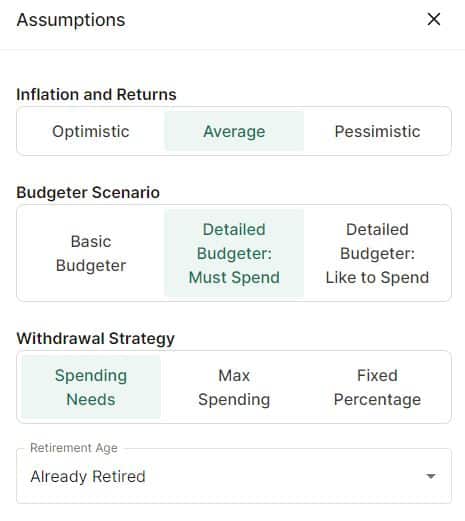
Now, with the click of a single button, I can view the impact to my financial forecast of applying optimistic, average or pessimistic market return assumptions.
Fidelity’s Return Assumptions
How does Fidelity’s Retirement Analysis tool treat expected portfolio returns? I am not entirely sure. The closest I could come to answering that question came from perusing documentation it publishes here and here. Neither document answers the question directly.
I suspect Fidelity’s methodology is similar to NewRetirement’s, or is at least based on sound assumptions. But I can’t be sure.
Regardless, I want a tool to give me the option to supply my own assumptions. NewRetirement’s PlannerPlus gives me that freedom, whereas Fidelity’s Retirement Analysis tool does not.
Expense Estimates
PlannerPlus handles expenses like any other parameter. There’s the quick and dirty Basic Budgeter that has you enter a single monthly number. Then there’s the more nuanced Detailed Budgeter that allows you to itemize your expenses. The latter more closely resembles the way I use Fidelity’s expense budgeter.
Fidelity’s Retirement Analysis tool allows you to break down expenses by category, and to separate each category into either essential or discretionary expense buckets.
PlannerPlus lets you split individual expense categories into must-spend and like-to-spend components. This gives you finer-grained control over what falls into the essential and discretionary buckets.
PlannerPlus goes a step further. It gives you a one-click toggle between your must-spend and like-to-spend budgets, so you can see at a glance the difference in impact belt-tightening (or loosening) will make to your financial forecast.

If nothing else, using the Detailed Budgeter forces you to take a close look at your expenses, which in and of itself is a useful exercise. Why? Because how much you spend in retirement is perhaps the most important–and underrated!–piece of the retirement puzzle.
Health Care Costs
PlannerPlus includes Medicare expenses in its default assumptions, and estimates my cost to be $738K over the course of my lifetime. This number changes depending on the premium level and coverage type I choose–parts A and B only, Medigap, drug plan, etc.
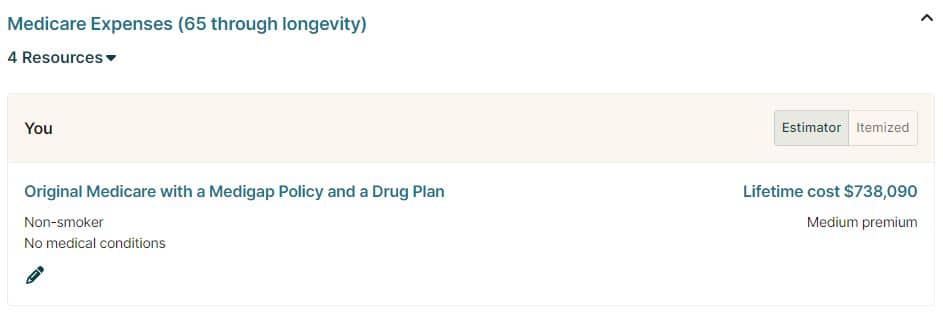
Fidelity’s Retirement Analysis tool makes no such assumption, and merely asks me to account for Medicare costs in my detailed expense estimates–regrettably, by calculating and entering these estimates manually.
To balance the comparison, I removed the Medicare estimate from PlannerPlus. Sure, I could have amortized PlannerPlus’ $738K over 35 years in the Fidelity calculator, but this would have been time consuming and error prone.
I mention this because the hypothetical forecasts presented in this review omit lifetime Medicare costs, and therefore skew more optimistic than if I had left them in.
In the next section, I’ll show you the effect on my PlannerPlus forecast of adding Medicare costs back in.
Comparing the Results
To the extent that I could, I duplicated my Fidelity inputs and assumptions in PlannerPlus. How do the results differ? Let’s start with my PlannerPlus forecasts.
PlannerPlus Outcomes
On the optimistic side of the ledger, PlannerPlus gives me a 99% chance of funding my retirement through age 100. So too in the average case. But on the pessimistic side of the ledger, it gives me just a 71% chance of not outliving my savings.

Even in the pessimistic case, PlannerPlus says I have just a 10% chance of running out of money by the time I reach 98. To the extent that I trust the assumptions behind the forecast, I think I can sleep at night with those odds.
Medicare Add-Back
What happens if I add back Medicare costs (recall that I removed these to stay level with the Fidelity comparison)? I am still sitting pretty, with 99% and 98% chances of success in the optimistic and average cases, respectively.
But the pessimistic case looks considerably worse.

PlannerPlus gives me just a 45% chance of success, compared with the 71% if I omit Medicare costs. This may seem dire, but I still have just a 10% chance of running out of money by the time I’m 91, and nearly even odds of making it to 100 given quite pessimistic market return and inflation assumptions. I still think I can sleep at night with those numbers.
Fidelity Retirement Analysis Outcomes
Fidelity’s tool does not provide single, chance-of-success probabilities for each of its optimistic, average and pessimistic forecasts (if they do, I couldn’t find them). So on that dimension it is impossible to make a direct comparison to PlannerPlus.
In Fidelity’s pessimistic forecast–what they call significantly below average market conditions–the value of my portfolio will be at least $6.5M when I reach 100, and that’s at the 90% confidence interval. This means that in 90% of Fidelity’s Monte Carlo simulations, the terminal value of my portfolio was $6.5M or greater (in future dollars).
PlannerPlus, on the other hand, puts me at breakeven (or better) when I’m 98 at the same confidence interval.
Takeaways
Why the huge discrepancy in terminal savings projections? Perhaps I am misunderstanding some fundamental aspect of one or the other, or both, tools. Or maybe it’s a tiny difference buried in the weeds somewhere, that when compounded over a period of 40 years adds up to a huge discrepancy. Maybe it is a flaw in the methodology in one or the other tool.
It’s likely due at least in part to a difference in market return assumptions. But Fidelity doesn’t disclose its return assumptions, so I can’t be sure.
Assuming I am not misunderstanding the tool(s)–and that, despite the considerable impedance mismatch between them, I am indeed comparing apples to apples–there is an important insight here. It is that retirement calculators are imperfect tools, and that none can predict the future with absolute certainty. Even the best tool can do no better than model an uncertain future.
This last point is an important one. It should remind us that retirement calculators are not set-it-and-forget-it tools.
If a retirement calculator says I have just a 45% chance of living to 100 without running out of money, you can bet I’ll be running the numbers again next year, and the year after that; then comparing the forecasts to reality and refining my assumptions accordingly.
Darrow and Chris have explored the topic of retirement calculator accuracy for years. For a trip down that rabbit hole, have a look into the curated list here (sorted newest to oldest).
NewRetirement Pricing
Before taking the plunge on PlannerPlus, take NewRetirement Basic for a spin. If you like what you see, then consider an upgrade. The Basic edition is, of course, free. A PlannerPlus subscription will set you back $120/year ($10/month), billed annually.
NewRetirement offers a third option–PlannerPlus Academy–for $270/year ($22.50/month). PlannerPlus Academy comes with all the features of PlannerPlus, but also includes priority support and live online classes. The classes are recorded, so if you miss one you can come back and watch it later.

If you decide to purchase a subscription, consider using the link here. It will help me, Chris and Darrow cover the costs of maintaining the blog, and contribute to our effort to dial back ads on the site.
Bonus Features
PlannerPlus is chock full of features I did not cover in the Fidelity comparison, but that nevertheless merit a mention.
Insights
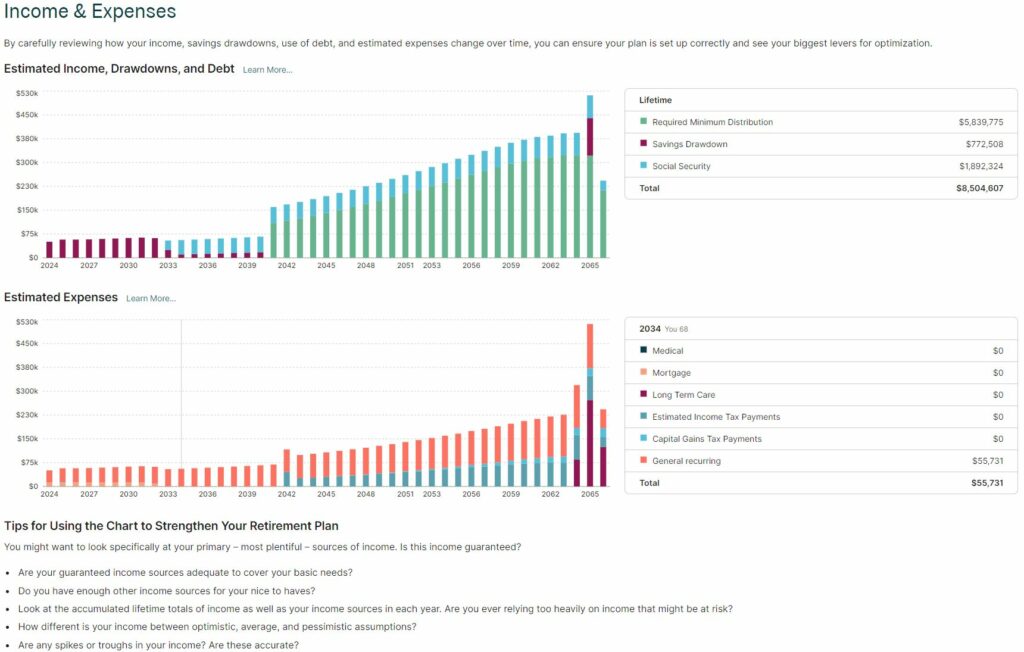
One of these is the Insights sidebar, which lets you zoom in on myriad topics such as net worth, cash flow, income, expenses, savings, Medicare, taxes and many more.
Each topic contains a detailed, individually tailored analysis based on your inputs, and features a rich set of charts and graphs to help you visualize these insights.
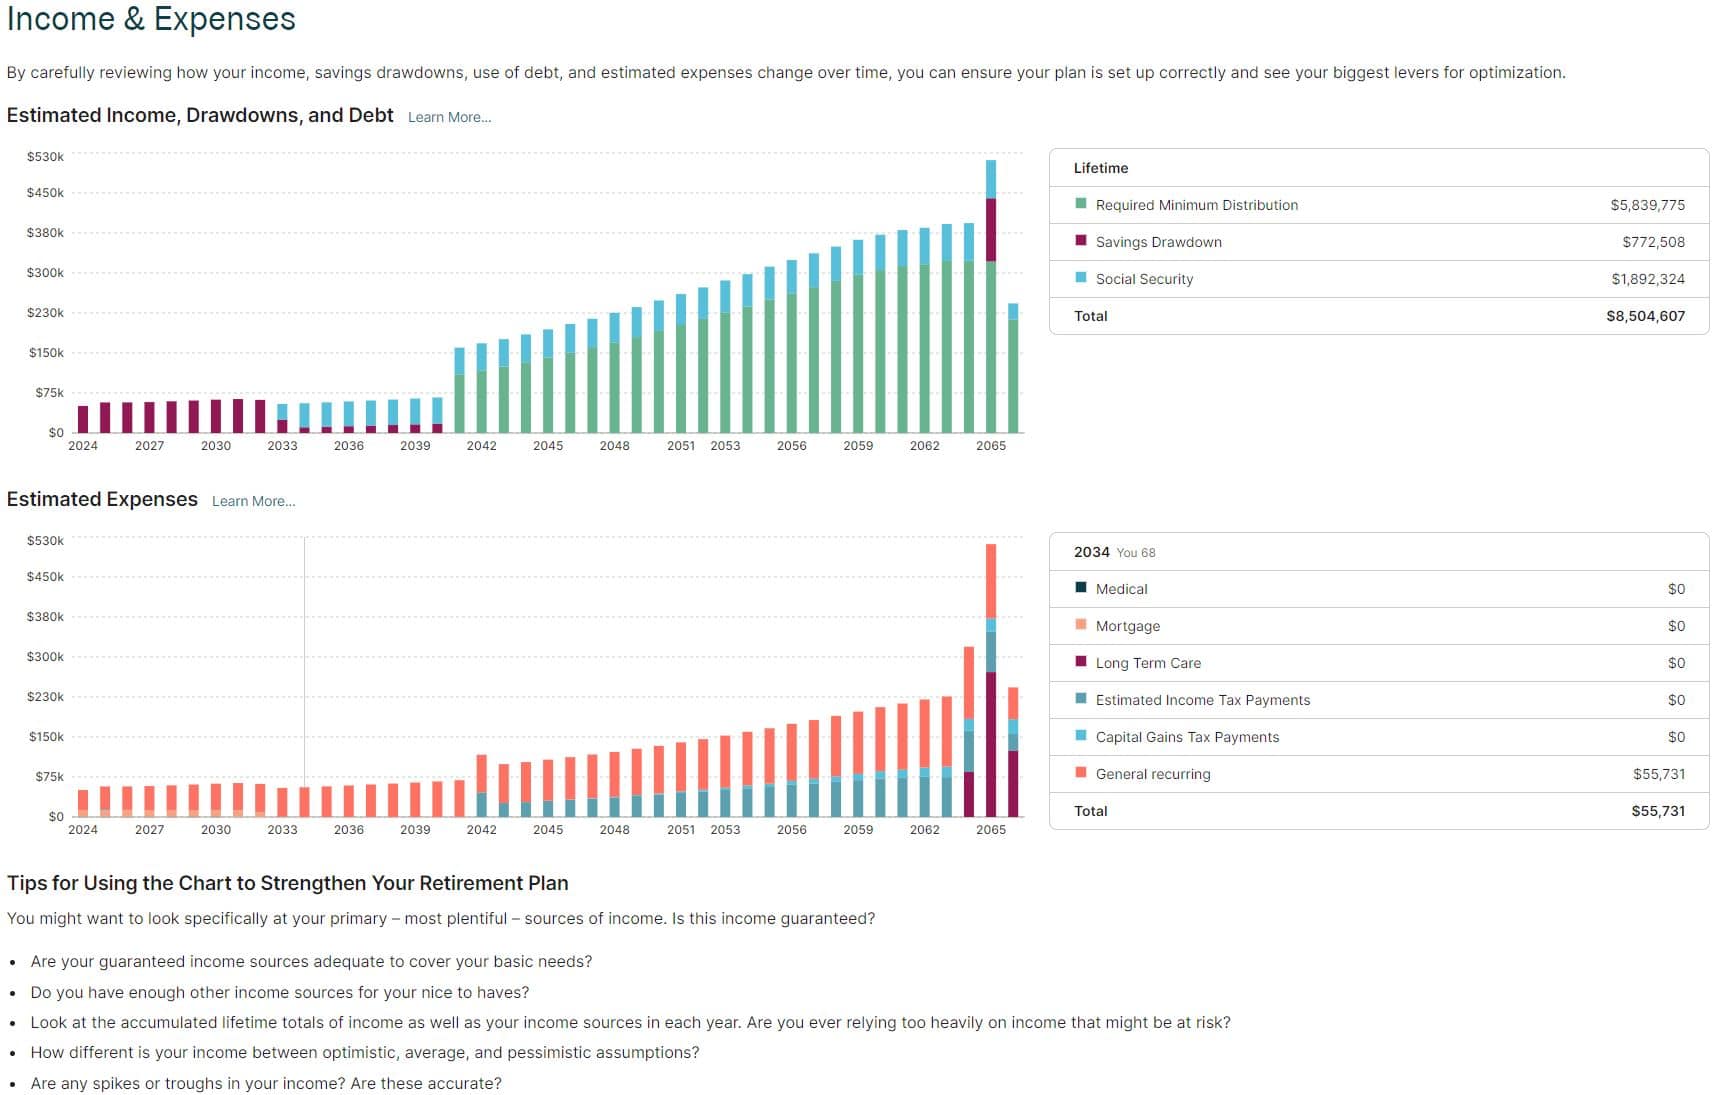
Here is but one example–the Income & Expenses insight–to whet your appetite:
Explorers
There’s also an Explorers sidebar, where you can run Monte Carlo analysis on your portfolios, varying parameters such as market returns, general inflation, medical inflation and wage growth.
You can also try various what-if scenarios, such as varying your investment returns by a single percentage point, or exploring the impact of living 5 years longer than expected. You can even explore social security and Roth conversion scenarios.
Coach Suggestions
Finally, there’s a Coach Suggestions sidebar. This feature takes a holistic view of the current state of your plan, identifying potential trouble spots and/or opportunities, and offers suggestions for how you might address them.
Nitpicks
Although I am completely sold on the PlannerPlus experience, I’ll mention a couple of nitpicks.
First, PlannerPlus expresses all dollar figures in inflation-adjusted, or future dollars (Fidelity’s tool allows you to toggle between present and future dollars). This has the effect of biasing me to the upside when looking at forecasts, particularly those that stretch far into the future.
My brain thinks in present dollars. I’d rather not do the mental conversion from future to present dollars every time I ponder a forecast.
Second, if you’re not careful, PlannerPlus will overstate the equity in your home. In the data entry screen for Housing, it asks you to enter your home’s current market value. It subtracts your mortgage balance (if any), and calls the difference your total home equity.

Of course, if you sell your house you will likely have to pay anywhere from 6% to 10% of its market value in broker fees and improvements. If you have an expensive house, this will reduce the actual value of your home equity by a considerable amount. If you don’t account for this, the overstatement will be reflected in PlannerPlus’ projected net worth estimate.
This problem is easily remedied by discounting the market value of your home by 6% to 10%, and entering that number instead, in the Home’s Current Value entry.
Finally, I had to employ the services of a 3rd party tool–PortfolioVisualizer–to generate plausible extremes for my optimistic and pessimistic portfolio return assumptions. It would be nice if PlannerPlus integrated such a tool into its own calculator.
Perhaps NewRetirement already plans to add this feature. Considering the number of improvements that have appeared in the three years since I first used PlannerPlus, I would not be surprised to see it turn up in a future release.
Programming Note
At the conclusion of last month’s post, Should You Pay Off Your Mortgage?, I mentioned that it would not be possible for me to read and reply to your comments. I was rafting the Colorado River in the Grand Canyon the week that post was published.
Having since read those comments, and spending a good deal of time ruminating on them, I am now seriously rethinking my decision not to pay off my mortgage. Thank you so much for your insights, many of which I had not previously considered.
I’ll be in the same church, but a different pew, this month. I will be rock climbing in the magnificent hills of Red Rock National Conservation Area west of Las Vegas.
As ever, please do not let this discourage you from leaving a comment, and/or conversing amongst yourselves. These are not only valuable to me (see above), but no doubt other readers as well.
* * *
Valuable Resources
- The Best Retirement Calculators can help you perform detailed retirement simulations including modeling withdrawal strategies, federal and state income taxes, healthcare expenses, and more. Can I Retire Yet? partners with two of the best.
- Free Travel or Cash Back with credit card rewards and sign up bonuses.
- Monitor Your Investment Portfolio
- Sign up for a free Empower account to gain access to track your asset allocation, investment performance, individual account balances, net worth, cash flow, and investment expenses.
- Our Books
* * *
[I’m David Champion. I retired from a career in software development in March 2019, just shy of my 53rd birthday. To position myself for 40+ years of worry-free retirement, I consumed all manner of early-retirement resources. Notable among these was CanIRetireYet, whose newsletters I have received in my inbox every Monday morning for the last ten years. CanIRetireYet is one of exactly two personal finance newsletters I subscribe to. Why? Because of the practical, no-nonsense advice I find here. I attribute my financial success in no small part to what I have learned from Darrow and Chris. In sharing some of my own observations on the early-retirement journey, I aim to maintain the high standard of value readers of CanIRetireYet have come to expect.]
* * *
Disclosure: Can I Retire Yet? has partnered with CardRatings for our coverage of credit card products. Can I Retire Yet? and CardRatings may receive a commission from card issuers. Some or all of the card offers that appear on the website are from advertisers. Compensation may impact on how and where card products appear on the site. The site does not include all card companies or all available card offers. Other links on this site, like the Amazon, NewRetirement, Pralana, and Personal Capital links are also affiliate links. As an affiliate we earn from qualifying purchases. If you click on one of these links and buy from the affiliated company, then we receive some compensation. The income helps to keep this blog going. Affiliate links do not increase your cost, and we only use them for products or services that we’re familiar with and that we feel may deliver value to you. By contrast, we have limited control over most of the display ads on this site. Though we do attempt to block objectionable content. Buyer beware.
Join more than 18,000 subscribers.
Get free regular updates from “Can I Retire Yet?” on saving, investing, retiring, and retirement income. New articles weekly.
You’re Almost Done – Activate Your Subscription! You’ve just been sent an email that contains a confirmation link. Please click the link in that email to finish your subscription.
Editor’s Note: Since he took over our Value Meter column in February, Director of Trading Anthony Summers has evaluated…
Copyright © 2024 Retiring & Happy. All rights reserved.


